
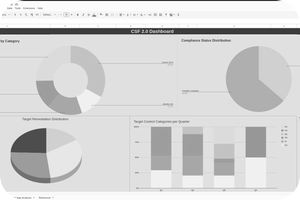
 You Security Dashboard is Green, so why are you still exposed?
Everything is green, the CISO is happy, management is reassured, and the Board can move on to the next agenda item.
But are you actually secure?
THE PROBLEM WITH GREEN
Let's take that 98% patching compliance.What if the remaining 2% includes your internet-facing VPN, a critical authentication server or your core business application?
Or that 99% EDR coverage, does it mean the agents are actually working? That your SOC can detect an attack? That someone will respond when an alert is triggered?
And zero incidents? Is that because nothing happened, or because nothing was detected?
The problem is not necessarily that your metrics are wrong, it's that they may be answering the wrong questions.
We measure what is easy to count, then assume those numbers represent our actual security posture.
But they don't... At least, not on their own: context and trend are important!
ACTIVITY IS NOT EFFECTIVENESS
There is a fundamental difference between measuring security activities and measuring security effectiveness, activities versus outcomes:- Patching 1,000 servers is an activity but ensuring your critical services are not exposed to known exploitable vulnerabilities is an outcome.
- Deploying EDR is an activity but demonstrating that your organisation can detect and contain a realistic attack is an outcome.
- Completing backup jobs is an activity but successfully restoring a critical business service within its required recovery time is an outcome.
Both types of measurements matter of course, however it is important to remember they tell very different stories.
And this is not a new concept: NIST's SP 800-55 guidance on information security measurement has long emphasised the importance of selecting meaningful measures aligned with organisational objectives.
Yet many cybersecurity dashboards still look more like operational activity reports than risk management tools.
WHAT SHOULD MANAGEMENT REALLY SEE?
I'm not suggesting we abandon traditional KPIs as they remain useful for operational teams.But management needs something more:
- Instead of simply reporting 98% patching compliance, explain which critical systems remain exposed and why.
- Instead of reporting 100% backup success, demonstrate whether critical business services can actually be recovered.
- Instead of celebrating zero incidents, provide evidence that your detection and response capabilities have been tested.
And perhaps most importantly, show what remains at risk, what the potential business impact is, and what decisions management needs to make.
Of course, this is harder than producing a dashboard full of percentages as it requires understanding business criticality, testing controls and accepting that some risks cannot be conveniently summarised by a green indicator.
But isn't that what cybersecurity risk management is supposed to be about?
CONCLUSION
A green dashboard is reassuring but sometimes too reassuring!Security metrics should help organisations make informed decisions, not simply demonstrate that the security team is busy or that predefined targets have been met.
So next time your cybersecurity dashboard is presented, ask one simple question:
Are we measuring how much security work we've done, or how well protected we actually are?
Because those are two very different things.